一, 前言
- 当我们把一条sql送到数据库去执行的时候,我们要知道,什么时候用到cpu,什么时候用到内存,什么时候用到io
在看性能指标的时候,心里先要明白,数据库出现性能问题,一般都在三个地方,io,内存,cpu,这三个又是息息相关的(ps:我们先假设这个三个地方都没有物理上的故障),当io负载增大时,肯定需要更多的内存来存放,同时也需要cpu花费更多的时间来过滤这些数据,相反,cpu时间花费多的话,有可能是解析sql语句,也可能是过滤太多的数据,到不一定是和io或内存有关系了 。
1. cpu:
解析sql语句,尝试多个执行计划,最后生成一个数据库认为是比较好的执行计划,不一定是最优的,因为关联表太多的时候,数据库并不会穷举所有的执行计划,这会消耗太多的时间,oracle怎么就知道这条数据时你要,另一个就不是你要的呢,这是需要cpu来过滤的
2. 内存:
sql语句和执行计划都需要在内存保留一段时间,还有取到的数据,根据lru算法也会尽量在内存中保留,在执行sql语句过程中,各种表之间的连接,排序等操作也要占用内存
3. io:
如果需要的数据在内存中没有,则需要到磁盘中去取,就会用到物理io了,还有表之间的连接数据太多,以及排序等操作内存放不下的时候,也需要用到临时表空间,也就用到物理io了
这里有一点说明的是,虽然oracle占用了8G的内存,但pga一般只占8G的20%,对于专用服务器模式,每次执行sql语句,表数据的运算等操作,都在pga中进行的,也就是说只能用1.6G左右的内存,如果多个用户都执行 多表关联,而且表数据又多,再加上关联不当的话,内存就成为瓶颈了,所有优化sql很重要的一点就是,减少逻辑读和物理读。
二,生成AWR报告
01 AWR的数据主要有两部分组成:
1)保存在内存中的系统负载和性能统计数据,主要通过v$视图查询 ;
2)mmon进程定期以快照(snapshot)的方式将内存中的AWR数据保存到SYSAUX表空间中,主要通过DBA_*视图访问。
02. AWR快照的生成
默认情况下,每隔一小时自动产生一个快照,保存最近7天的信息,可以通过以下语句查询:
SQL>select SNAP_INTERVAL,RETENTION from dba_hist_wr_control;

SNAP_INTERVAL
---------------------------------------------------------------------------RETENTION
---------------------------------------------------------------------------+0000001:00:00.0+0000800:00:00.0
可以通过以下语句修改时间间隔和保存时间(以分钟为单位):
exec dbms_workload_repository.modify_snapshot_settings(interval => 30, retention = > 10*24*60);
也可以根据需要随时手动生成快照:
exec dbms_workload_repository.create_snapshot;
03. AWR报告的生成
以sysdba运行如下命令:
@?/rdbms/admin/awrrpt.sql
            [
            oracle@node12c01 ~
            ]$ sqlplus /as sysdba

SQL*Plus: Release 12.2.0.1.0 Production on Wed Apr 1702:20:312019

Copyright (c) 1982, 2016, Oracle.  All rights reserved.


Connected to:
Oracle Database 12c Enterprise Edition Release 12.2.0.1.0- 64bit Production

SQL> @?/rdbms/admin/awrrpt.sql  --执行生成报表

Specify the Report Type
~~~~~~~~~~~~~~~~~~~~~~~
AWR reports can be generated in the following formats.    Please enter the
name of the format at the prompt.  Default value is‘html‘.

‘html‘        HTML format (default)
‘text‘Text format
‘active-html‘    Includes Performance Hub active report

Enter value for report_type: html            --选择你要生成的类型,类型有上显示
old   1: select‘Type Specified: ‘,lower(nvl(‘&&report_type‘,‘html‘)) report_type from dual
new   1: select‘Type Specified: ‘,lower(nvl(‘html‘,‘html‘)) report_type from dual

Type Specified:  html

old   1: select‘&&report_type‘ report_type_def from dual
new   1: select‘html‘ report_type_def from dual


old   1: select‘&&view_loc‘ view_loc_def from dual
new   1: select‘AWR_PDB‘ view_loc_def from dual


Current Instance
~~~~~~~~~~~~~~~~
DB Id           DB Name          Inst Num         Instance        Container Name
-------------- -------------- -------------- -------------- --------------1532278336    ORCL                1 orcl         CDB$ROOT


Instances in this Workload Repository schema~~~~~~~~~~~~~~~~~~~~~~~~~~~~~~~~~~~~~~~~~~~~
  DB Id      Inst Num    DB Name      Instance      Host
------------ ---------- ---------    ----------   ------*15322783361    ORCL         orcl      node12c01

Using 1532278336fordatabase Id
Using           1for instance number


Specify the numberof days of snapshots to choose from~~~~~~~~~~~~~~~~~~~~~~~~~~~~~~~~~~~~~~~~~~~~~~~~~~~~~~
Entering the numberof days (n) will result in the most recent
(n) days of snapshots being listed.  Pressing <return> without
specifying a number lists all completed snapshots.


Enter value for num_days: 7    --选择时间范围

Listing the last 7 days of Completed Snapshots
Instance     DB Name      Snap Id    Snap Started    Snap Level------------ ------------ ---------- ------------------ ----------
orcl         ORCL        21311 Apr 201900:00121411 Apr 201901:00121511 Apr 201902:00121611 Apr 201903:00121711 Apr 201904:00121811 Apr 201905:00121911 Apr 201906:00122011 Apr 201907:00122111 Apr 201908:00122211 Apr 201909:00122311 Apr 201910:00122411 Apr 201911:00122511 Apr 201912:00122611 Apr 201913:00122711 Apr 201914:00122811 Apr 201915:00122911 Apr 201916:00123011 Apr 201917:00123111 Apr 201918:00123211 Apr 201919:00123311 Apr 201920:00123411 Apr 201921:00123511 Apr 201922:00123611 Apr 201923:00123712 Apr 201900:00123812 Apr 201901:00123912 Apr 201902:00124012 Apr 201903:00124112 Apr 201904:00124212 Apr 201905:00124312 Apr 201906:00124412 Apr 201907:00124512 Apr 201908:00124612 Apr 201909:00124712 Apr 201910:00124812 Apr 201911:00124912 Apr 201912:00125012 Apr 201913:00125112 Apr 201914:00125212 Apr 201915:00125312 Apr 201916:00125412 Apr 201917:00125512 Apr 201918:00125612 Apr 201919:00125712 Apr 201920:00125812 Apr 201921:00125912 Apr 201922:00126012 Apr 201923:00126113 Apr 201900:00126213 Apr 201901:00126313 Apr 201902:00126413 Apr 201903:00126513 Apr 201904:00126613 Apr 201905:00126713 Apr 201906:00126813 Apr 201907:001
Instance     DB Name      Snap Id    Snap Started    Snap Level------------ ------------ ---------- ------------------ ----------
orcl         ORCL        26913 Apr 201908:00127013 Apr 201909:00127113 Apr 201910:00127213 Apr 201911:00127313 Apr 201912:00127413 Apr 201913:00127513 Apr 201914:00127613 Apr 201915:00127713 Apr 201916:00127813 Apr 201917:00127913 Apr 201918:00128013 Apr 201919:00128113 Apr 201920:00128213 Apr 201921:00128313 Apr 201922:00128413 Apr 201923:00128514 Apr 201900:00128614 Apr 201901:00128714 Apr 201902:00128814 Apr 201903:00128914 Apr 201904:00129014 Apr 201905:00129114 Apr 201906:00129214 Apr 201907:00129314 Apr 201908:00129414 Apr 201909:00129514 Apr 201910:00129614 Apr 201911:00129714 Apr 201912:00129814 Apr 201913:00129914 Apr 201914:00130014 Apr 201915:00130114 Apr 201916:00130214 Apr 201917:00130314 Apr 201918:00130414 Apr 201919:00130514 Apr 201920:00130614 Apr 201921:00130714 Apr 201922:00130814 Apr 201923:00130915 Apr 201900:00131015 Apr 201901:00131115 Apr 201902:00131215 Apr 201903:00131315 Apr 201904:00131415 Apr 201905:00131515 Apr 201906:00131615 Apr 201907:00131715 Apr 201908:00131815 Apr 201909:00131915 Apr 201910:00132015 Apr 201911:00132115 Apr 201912:00132215 Apr 201913:00132315 Apr 201914:00132415 Apr 201915:001
Instance     DB Name      Snap Id    Snap Started    Snap Level------------ ------------ ---------- ------------------ ----------
orcl         ORCL        32515 Apr 201916:00132615 Apr 201917:00132715 Apr 201918:00132815 Apr 201919:00132915 Apr 201920:00133015 Apr 201921:00133115 Apr 201922:00133215 Apr 201923:00133316 Apr 201900:00133416 Apr 201901:00133516 Apr 201902:00133616 Apr 201903:00133716 Apr 201904:00133816 Apr 201905:00133916 Apr 201906:00134016 Apr 201907:00134116 Apr 201908:00134216 Apr 201909:00134316 Apr 201910:00134416 Apr 201911:00134516 Apr 201912:00134616 Apr 201913:00134716 Apr 201914:00134816 Apr 201915:00134916 Apr 201916:00135016 Apr 201917:00135116 Apr 201918:00135216 Apr 201919:00135316 Apr 201920:00135416 Apr 201921:00135516 Apr 201922:00135616 Apr 201923:00135717 Apr 201900:00135817 Apr 201901:00135917 Apr 201902:001


Specify the BeginandEnd Snapshot Ids
~~~~~~~~~~~~~~~~~~~~~~~~~~~~~~~~~~~~~~
Enter value for begin_snap: 213     --生成开始的idBegin Snapshot Id specified: 213

Enter value for end_snap: 359        --生成结束的idEnd   Snapshot Id specified: 359


Specify the Report Name
~~~~~~~~~~~~~~~~~~~~~~~
The default report file name is awrrpt_1_213_359.html.    Touse this name,
press <return>tocontinue, otherwise enter an alternative.

Enter value for report_name:   选择自己的名字

Using the report name awrrpt_1_213_359.html
具体操作:


1
[
oracle@node12c01 ~
]$ sqlplus /as sysdba
2 3 SQL*Plus: Release 12.2.0.1.0 Production on Wed Apr 1702:20:312019 4 5 Copyright (c) 1982, 2016, Oracle. All rights reserved.
6 7 8 Connected to:
9 Oracle Database 12c Enterprise Edition Release 12.2.0.1.0- 64bit Production
10 11 SQL> @?/rdbms/admin/awrrpt.sql --执行生成报表 12 13Specify the Report Type
14~~~~~~~~~~~~~~~~~~~~~~~ 15 AWR reports can be generated in the following formats. Please enter the
16 name of the format at the prompt. Default value is‘html‘.
17 18‘html‘ HTML format (default)
19‘text‘Text format
20‘active-html‘ Includes Performance Hub active report
21 22 Enter value for report_type: html --选择你要生成的类型,类型有上显示 23 old 1: select‘Type Specified: ‘,lower(nvl(‘&&report_type‘,‘html‘)) report_type from dual
24 new 1: select‘Type Specified: ‘,lower(nvl(‘html‘,‘html‘)) report_type from dual
25 26Type Specified: html
27 28 old 1: select‘&&report_type‘ report_type_def from dual
29 new 1: select‘html‘ report_type_def from dual
30 31 32 33 old 1: select‘&&view_loc‘ view_loc_def from dual
34 new 1: select‘AWR_PDB‘ view_loc_def from dual
35 36 37 38Current Instance
39~~~~~~~~~~~~~~~~ 40DB Id DB Name Inst Num Instance Container Name
41-------------- -------------- -------------- -------------- -------------- 421532278336 ORCL 1 orcl CDB$ROOT
43 44 45 46 47 48 49 50 51 52 53 54 Instances in this Workload Repository schema 55~~~~~~~~~~~~~~~~~~~~~~~~~~~~~~~~~~~~~~~~~~~~ 56 DB Id Inst Num DB Name Instance Host
57------------ ---------- --------- ---------- ------ 58*15322783361 ORCL orcl node12c01
59 60 Using 1532278336fordatabase Id
61 Using 1for instance number 62 63 64 Specify the numberof days of snapshots to choose from 65~~~~~~~~~~~~~~~~~~~~~~~~~~~~~~~~~~~~~~~~~~~~~~~~~~~~~~ 66 Entering the numberof days (n) will result in the most recent
67 (n) days of snapshots being listed. Pressing <return> without
68 specifying a number lists all completed snapshots.
69 70 71 Enter value for num_days: 7--选择时间范围 72 73 Listing the last 7 days of Completed Snapshots
74 Instance DB Name Snap Id Snap Started Snap Level 75------------ ------------ ---------- ------------------ ---------- 76 77 orcl ORCL 21311 Apr 201900:001 7821411 Apr 201901:001 7921511 Apr 201902:001 8021611 Apr 201903:001 8121711 Apr 201904:001 8221811 Apr 201905:001 8321911 Apr 201906:001 8422011 Apr 201907:001 8522111 Apr 201908:001 8622211 Apr 201909:001 8722311 Apr 201910:001 8822411 Apr 201911:001 8922511 Apr 201912:001 9022611 Apr 201913:001 9122711 Apr 201914:001 9222811 Apr 201915:001 9322911 Apr 201916:001 9423011 Apr 201917:001 9523111 Apr 201918:001 9623211 Apr 201919:001 9723311 Apr 201920:001 9823411 Apr 201921:001 9923511 Apr 201922:00110023611 Apr 201923:00110123712 Apr 201900:00110223812 Apr 201901:00110323912 Apr 201902:00110424012 Apr 201903:00110524112 Apr 201904:00110624212 Apr 201905:00110724312 Apr 201906:00110824412 Apr 201907:00110924512 Apr 201908:00111024612 Apr 201909:00111124712 Apr 201910:00111224812 Apr 201911:00111324912 Apr 201912:00111425012 Apr 201913:00111525112 Apr 201914:00111625212 Apr 201915:00111725312 Apr 201916:00111825412 Apr 201917:00111925512 Apr 201918:00112025612 Apr 201919:00112125712 Apr 201920:00112225812 Apr 201921:00112325912 Apr 201922:00112426012 Apr 201923:00112526113 Apr 201900:00112626213 Apr 201901:00112726313 Apr 201902:00112826413 Apr 201903:00112926513 Apr 201904:00113026613 Apr 201905:00113126713 Apr 201906:00113226813 Apr 201907:001133 Instance DB Name Snap Id Snap Started Snap Level134------------ ------------ ---------- ------------------ ----------135136 orcl ORCL 26913 Apr 201908:00113727013 Apr 201909:00113827113 Apr 201910:00113927213 Apr 201911:00114027313 Apr 201912:00114127413 Apr 201913:00114227513 Apr 201914:00114327613 Apr 201915:00114427713 Apr 201916:00114527813 Apr 201917:00114627913 Apr 201918:00114728013 Apr 201919:00114828113 Apr 201920:00114928213 Apr 201921:00115028313 Apr 201922:00115128413 Apr 201923:00115228514 Apr 201900:00115328614 Apr 201901:00115428714 Apr 201902:00115528814 Apr 201903:00115628914 Apr 201904:00115729014 Apr 201905:00115829114 Apr 201906:00115929214 Apr 201907:00116029314 Apr 201908:00116129414 Apr 201909:00116229514 Apr 201910:00116329614 Apr 201911:00116429714 Apr 201912:00116529814 Apr 201913:00116629914 Apr 201914:00116730014 Apr 201915:00116830114 Apr 201916:00116930214 Apr 201917:00117030314 Apr 201918:00117130414 Apr 201919:00117230514 Apr 201920:00117330614 Apr 201921:00117430714 Apr 201922:00117530814 Apr 201923:00117630915 Apr 201900:00117731015 Apr 201901:00117831115 Apr 201902:00117931215 Apr 201903:00118031315 Apr 201904:00118131415 Apr 201905:00118231515 Apr 201906:00118331615 Apr 201907:00118431715 Apr 201908:00118531815 Apr 201909:00118631915 Apr 201910:00118732015 Apr 201911:00118832115 Apr 201912:00118932215 Apr 201913:00119032315 Apr 201914:00119132415 Apr 201915:001192 Instance DB Name Snap Id Snap Started Snap Level193------------ ------------ ---------- ------------------ ----------194195 orcl ORCL 32515 Apr 201916:00119632615 Apr 201917:00119732715 Apr 201918:00119832815 Apr 201919:00119932915 Apr 201920:00120033015 Apr 201921:00120133115 Apr 201922:00120233215 Apr 201923:00120333316 Apr 201900:00120433416 Apr 201901:00120533516 Apr 201902:00120633616 Apr 201903:00120733716 Apr 201904:00120833816 Apr 201905:00120933916 Apr 201906:00121034016 Apr 201907:00121134116 Apr 201908:00121234216 Apr 201909:00121334316 Apr 201910:00121434416 Apr 201911:00121534516 Apr 201912:00121634616 Apr 201913:00121734716 Apr 201914:00121834816 Apr 201915:00121934916 Apr 201916:00122035016 Apr 201917:00122135116 Apr 201918:00122235216 Apr 201919:00122335316 Apr 201920:00122435416 Apr 201921:00122535516 Apr 201922:00122635616 Apr 201923:00122735717 Apr 201900:00122835817 Apr 201901:00122935917 Apr 201902:001230231232 Specify the BeginandEnd Snapshot Ids
233~~~~~~~~~~~~~~~~~~~~~~~~~~~~~~~~~~~~~~234 Enter value for begin_snap: 213--生成开始的id235Begin Snapshot Id specified: 213236237 Enter value for end_snap: 359--生成结束的id238End Snapshot Id specified: 359239240241242Specify the Report Name
243~~~~~~~~~~~~~~~~~~~~~~~244 The default report file name is awrrpt_1_213_359.html. Touse this name,
245 press <return>tocontinue, otherwise enter an alternative.
246247 Enter value for report_name: 选择自己的名字
248249Using the report name awrrpt_1_213_359.html
250251.........................................
252253<td class=‘awrnc‘>254CDB$ROOT
255</td></tr>256</table><p />257<hr align="left" width="20%" /><p />258<a class="awr" href="#36">Back to init.ora Parameters</a>259<br /><a class="awr" href="#top">Back toTop</a><p />260<p />261<a class="awr" name="99995"></a>262<h2>ADDM Task ADDM:1532278336_1_282</h2>263<pre>264 ADDM Report for Task 'ADDM:1532278336_1_282'
265--------------------------------------------266267Analysis Period
268---------------269 AWR snapshot range from281to282.
270 Time period starts at 13-APR-1908.00.39 PM
271 Time period ends at 13-APR-1909.00.44 PM
272273Analysis Target
274---------------275Database'ORCL' with DB ID 1532278336.
276Database version 12.2.0.1.0.
277 ADDM performed an analysis of instance orcl, numbered 1and hosted at
278node12c01.
279280Activity During the Analysis Period
281-----------------------------------282 Total database time was 191 seconds.
283 The average numberof active sessions was .05.
284285286~~~~~~~~~~~~~~~~~~~~~~~~~~~~~~~~~~~~~~~~~~~~~~~~~~~~~~~~~~~~~~~~~~~~~~~~~~~~~~287~~~~~~~~~~~~~~~~~~~~~~~~~~~~~~~~~~~~~~~~~~~~~~~~~~~~~~~~~~~~~~~~~~~~~~~~~~~~~~288289 There are no findings to report.
290291~~~~~~~~~~~~~~~~~~~~~~~~~~~~~~~~~~~~~~~~~~~~~~~~~~~~~~~~~~~~~~~~~~~~~~~~~~~~~~292~~~~~~~~~~~~~~~~~~~~~~~~~~~~~~~~~~~~~~~~~~~~~~~~~~~~~~~~~~~~~~~~~~~~~~~~~~~~~~293294 Additional Information
295----------------------296297Miscellaneous Information
298-------------------------299 There was no significant database activity to run the ADDM.
300301 The database's maintenance windows were active during 99%of the analysis
302period.
303304</pre>305<h2>ADDM Task ADDM:1532278336_1_306</h2>306<pre>307 ADDM Report for Task 'ADDM:1532278336_1_306'
308--------------------------------------------309310Analysis Period
311---------------312 AWR snapshot range from305to306.
313 Time period starts at 14-APR-1908.00.33 PM
314 Time period ends at 14-APR-1909.00.38 PM
315316Analysis Target
317---------------318Database'ORCL' with DB ID 1532278336.
319Database version 12.2.0.1.0.
320 ADDM performed an analysis of instance orcl, numbered 1and hosted at
321node12c01.
322323Activity During the Analysis Period
324-----------------------------------325 Total database time was 180 seconds.
326 The average numberof active sessions was .05.
327328329~~~~~~~~~~~~~~~~~~~~~~~~~~~~~~~~~~~~~~~~~~~~~~~~~~~~~~~~~~~~~~~~~~~~~~~~~~~~~~330~~~~~~~~~~~~~~~~~~~~~~~~~~~~~~~~~~~~~~~~~~~~~~~~~~~~~~~~~~~~~~~~~~~~~~~~~~~~~~331332 There are no findings to report.
333334~~~~~~~~~~~~~~~~~~~~~~~~~~~~~~~~~~~~~~~~~~~~~~~~~~~~~~~~~~~~~~~~~~~~~~~~~~~~~~335~~~~~~~~~~~~~~~~~~~~~~~~~~~~~~~~~~~~~~~~~~~~~~~~~~~~~~~~~~~~~~~~~~~~~~~~~~~~~~336337 Additional Information
338----------------------339340Miscellaneous Information
341-------------------------342 There was no significant database activity to run the ADDM.
343344 The database's maintenance windows were active during 100%of the analysis
345period.
346347</pre>348<h2>ADDM Task ADDM:1532278336_1_305</h2>349<pre>350 ADDM Report for Task 'ADDM:1532278336_1_305'
351--------------------------------------------352353Analysis Period
354---------------355 AWR snapshot range from304to305.
356 Time period starts at 14-APR-1907.00.28 PM
357 Time period ends at 14-APR-1908.00.33 PM
358359Analysis Target
360---------------361Database'ORCL' with DB ID 1532278336.
362Database version 12.2.0.1.0.
363 ADDM performed an analysis of instance orcl, numbered 1and hosted at
364node12c01.
365366Activity During the Analysis Period
367-----------------------------------368 Total database time was 168 seconds.
369 The average numberof active sessions was .05.
370371372~~~~~~~~~~~~~~~~~~~~~~~~~~~~~~~~~~~~~~~~~~~~~~~~~~~~~~~~~~~~~~~~~~~~~~~~~~~~~~373~~~~~~~~~~~~~~~~~~~~~~~~~~~~~~~~~~~~~~~~~~~~~~~~~~~~~~~~~~~~~~~~~~~~~~~~~~~~~~374375 There are no findings to report.
376377~~~~~~~~~~~~~~~~~~~~~~~~~~~~~~~~~~~~~~~~~~~~~~~~~~~~~~~~~~~~~~~~~~~~~~~~~~~~~~378~~~~~~~~~~~~~~~~~~~~~~~~~~~~~~~~~~~~~~~~~~~~~~~~~~~~~~~~~~~~~~~~~~~~~~~~~~~~~~379380 Additional Information
381----------------------382383Miscellaneous Information
384-------------------------385 There was no significant database activity to run the ADDM.
386387 The database's maintenance windows were active during 99%of the analysis
388period.
389390</pre>391<br /><a class="awr" href="#top">Back toTop</a><p />392<p />393<p />394<p />395<p />396<p />397<p />398<p />399<p />400<p />401Endof Report
402</body></html>
完成后会生成一个报表具体根据自己的观看

三,AWR
01, AWR
首先要看俩个时间
Elapsed: 240.00 (mins) 表明采样时间是240分钟,任何数据都要通过这个时间来衡量,离开了这个采样时间,任何数据都毫无疑义
DB Time: 92,537.95 (mins) 表明用户操作花费的时候,包括cpu时间喝等待时间,也许有人会觉得奇怪,为什么在采样的240分钟过程中,用户操作时间竟然有92537分钟呢,远远超过了
采样时间,原因是awr报告是一个数据的集合,比如在一分钟之内,一个用户等待了30秒,那么10个用户就等待了300秒,对于cpu的话,一个cpu处理了30秒,16个cpu就是4800秒,这些时间都是以累积的方式记录在awr报告中的。
为了对数据库有个整体的认识,先看下面的性能指标

1. Buffer Nowait 说明 在从内存取数据的时候,没有经历等待的比例,期望值是100%
2. Buffer Hit
说明从内存取数据的时候,buffer的命中率的比例,期望值是100%,但100%并不代表性能就好,因为这只是一个比例而已,举个例子,执行一条
sql语句,#
执行计划是需要取10000个数据块,结果内存中还真有这10000个数据块,那么比例是100%,表面上看是性能最高的,还有一个执行计划是需要500
个数据块,内存中有250个,另外250个需要在物理磁盘中取,
这种情况下,buffer hit是50%,结果呢,第二个执行计划性能才是最高的,所以说100%并不代表性能最好
3. Library Hit 说明sql在Shared Pool的命中率,期望值是100%
4. Execute to Parse 说明解析sql和执行sql之间的比例,越高越好,说明一次解析,到处执行,如果parse多,execute少的话,还会出现负数,因为计算公式是100*(1-parse/execute)
5. Parse CPU to Parse Elapsd 说明在解析sql语句过程中,cpu占整个的解析时间比例,,期望值是100%,说明没有产生等待,需要说明的是,即使有硬解析,只要cpu没有出现性能问题,也是可以容忍的,比较硬解析也有它的好处的
6. Redo NoWait 说明在产生日志的时候,没有产生等待,期望值是100%
7. Soft Parse 说明软解析的比例,期望值是100%,有一点要说明的是,不要单方面的追求软解析的高比例,而去绑定变量,要看性能的瓶颈在哪里
8. Latch Hit 说明latch的命中率,期望值是100%,latch类似锁,是一种内存锁,但只会产生等待,不会产生阻塞,和lock还是有区别的,latch是在并发的情况下产生的
9. Non-Parse CPU 说明非解析cpu的比例,越高越好,用100减去这个比例,可以看出解析sql所花费的cpu,100-99.30=0.7,说明花费在解析sql上的cpu很少
- Time Model Statistics

可以看出,在整个sql执行时间(sql execute elapsed time)时间为5144秒中,解析时间(parse time elapsed)用了将近900秒秒,硬解析时间(hard parse elapsed time)用了同样也用了快900秒,硬解析时间占了整个解析时间的绝大部分,但解析时间是花的也特别多,所以可以判断出,sql的解析成为性能的瓶 颈,进一步推测,sql在获取数据的过程中倒是没有太多时间
- Top 5 Timed Events,从这里可以看出等待时间在前五位的是什么事件,基本上就可以判断出性能瓶颈在什么地方
| Event | Waits | %Time -outs | Total Wait Time (s) | Avg wait | Waits /txn | % DB time |
|---|---|---|---|---|---|---|
| acknowledge over PGA limit | 250,355 | 100 | 2,909 | 11.62ms | 3.35 | 38.13 |
| PGA memory operation | 1,208,786 | 16 | 13.24us | 16.16 | 0.21 | |
| Failed Logon Delay | 13 | 100 | 13 | 1000.08ms | 0.00 | 0.17 |
| Pluggable Database file copy | 2,918 | 11 | 3.85ms | 0.04 | 0.15 | |
| enq: JG - queue lock | 12 | 8 | 662.24ms | 0.00 | 0.10 | |
| Disk file operations I/O | 49,900 | 8 | 157.65us | 0.67 | 0.10 | |
| db file sequential read | 30,552 | 7 | 240.51us | 0.41 | 0.10 | |
| log file sync | 2,498 | 7 | 2.73ms | 0.03 | 0.09 | |
| local write wait | 1,825 | 5 | 2.84ms | 0.02 | 0.07 | |
| enq: RO - fast object reuse | 1,450 | 4 | 2.93ms | 0.02 | 0.06 | |
| control file parallel write | 742 | 2 | 2.72ms | 0.01 | 0.03 | |
| enq: CR - block range reuse ckpt | 606 | 2 | 3.17ms | 0.01 | 0.03 | |
| resmgr:cpu quantum | 68 | 2 | 24.59ms | 0.00 | 0.02 | |
| reliable message | 2,432 | 1 | 609.97us | 0.03 | 0.02 | |
| library cache lock | 22 | 1 | 63.11ms | 0.00 | 0.02 | |
| latch: shared pool | 1,304 | 1 | 1.04ms | 0.02 | 0.02 | |
| recovery area: computing obsolete files | 5 | 1 | 231.36ms | 0.00 | 0.02 | |
| sort segment request | 1 | 100 | 1 | 999.28ms | 0.00 | 0.01 |
| ADR block file read | 171 | 1 | 5.60ms | 0.00 | 0.01 | |
| db file scattered read | 1,036 | 1 | 559.15us | 0.01 | 0.01 | |
| direct path sync | 209 | 0 | 1.97ms | 0.00 | 0.01 | |
| recovery area: computing backed up files | 5 | 0 | 73.53ms | 0.00 | 0.00 | |
| DLM cross inst call completion | 80 | 0 | 3.71ms | 0.00 | 0.00 | |
| undo segment extension | 47 | 98 | 0 | 4.59ms | 0.00 | 0.00 |
| library cache: mutex X | 60 | 0 | 3.06ms | 0.00 | 0.00 | |
| control file single write | 150 | 0 | 1.10ms | 0.00 | 0.00 | |
| row cache mutex | 61 | 0 | 2.52ms | 0.00 | 0.00 | |
| cursor: pin S wait on X | 19 | 0 | 7.30ms | 0.00 | 0.00 | |
| rdbms ipc reply | 70 | 0 | 1.84ms | 0.00 | 0.00 | |
| control file sequential read | 21,699 | 0 | 5.83us | 0.29 | 0.00 | |
| resmgr:internal state change | 1 | 0 | 99.93ms | 0.00 | 0.00 | |
| PX Deq: Slave Session Stats | 388 | 0 | 238.38us | 0.01 | 0.00 | |
| log buffer space | 1 | 0 | 78.54ms | 0.00 | 0.00 | |
| db file single write | 75 | 0 | 929.52us | 0.00 | 0.00 | |
| library cache load lock | 17 | 0 | 3.74ms | 0.00 | 0.00 | |
| recovery area: computing dropped files | 5 | 0 | 12.08ms | 0.00 | 0.00 | |
| db file parallel read | 273 | 0 | 203.64us | 0.00 | 0.00 | |
| row cache lock | 11 | 0 | 5.01ms | 0.00 | 0.00 | |
| Data file init write | 88 | 0 | 526.43us | 0.00 | 0.00 | |
| SQL*Net break/reset to client | 299 | 0 | 132.44us | 0.00 | 0.00 | |
| log file switch (private strand flush incomplete) | 2 | 0 | 18.91ms | 0.00 | 0.00 | |
| direct path write temp | 219 | 0 | 158.95us | 0.00 | 0.00 | |
| PX Deq: Join ACK | 88 | 0 | 376.35us | 0.00 | 0.00 | |
| resmgr:plan change | 10 | 0 | 3.22ms | 0.00 | 0.00 | |
| library cache: bucket mutex X | 7 | 0 | 4.54ms | 0.00 | 0.00 | |
| Compression analysis | 10,212 | 0 | 3.04us | 0.14 | 0.00 | |
| oracle thread bootstrap | 4 | 0 | 6.92ms | 0.00 | 0.00 | |
| latch free | 19 | 0 | 1.12ms | 0.00 | 0.00 | |
| latch: enqueue hash chains | 2 | 0 | 10.64ms | 0.00 | 0.00 | |
| write complete waits | 6 | 0 | 3.53ms | 0.00 | 0.00 | |
| enq: TX - contention | 3 | 0 | 6.79ms | 0.00 | 0.00 | |
| asynch descriptor resize | 1,230 | 100 | 0 | 7.39us | 0.02 | 0.00 |
| row cache read | 8 | 0 | .96ms | 0.00 | 0.00 | |
| PX Deq: Signal ACK EXT | 44 | 0 | 164.02us | 0.00 | 0.00 | |
| buffer busy waits | 15 | 0 | 471.87us | 0.00 | 0.00 | |
| enq: TC - contention | 8 | 0 | 618.25us | 0.00 | 0.00 | |
| enq: PS - contention | 8 | 0 | 607.88us | 0.00 | 0.00 | |
| kdic_do_merge | 816 | 0 | 4.81us | 0.01 | 0.00 | |
| enq: CU - contention | 1 | 0 | 3.40ms | 0.00 | 0.00 | |
| SQL*Net message to client | 4,903 | 0 | 647.15ns | 0.07 | 0.00 | |
| CSS initialization | 1 | 0 | 3.07ms | 0.00 | 0.00 | |
| cursor: pin S | 2 | 0 | 1.14ms | 0.00 | 0.00 | |
| direct path write | 10 | 0 | 215.40us | 0.00 | 0.00 | |
| latch: call allocation | 2 | 0 | 1.00ms | 0.00 | 0.00 | |
| latch: cache buffers chains | 3 | 0 | 566.00us | 0.00 | 0.00 | |
| latch: redo allocation | 3 | 0 | 345.00us | 0.00 | 0.00 | |
| watchdog main loop | 350,487 | 1,051,183 | 2999.21ms | 4.69 | ||
| jobq slave wait | 182,465 | 99 | 90,696 | 497.06ms | 2.44 | |
| SQL*Net message from client | 4,902 | 87,039 | 17.76 s | 0.07 | ||
| PL/SQL lock timer | 606 | 100 | 606 | 999.71ms | 0.01 | |
| PX Deq: Execution Msg | 1,677 | 22 | 13.22ms | 0.02 | ||
| PX Deq: Execute Reply | 220 | 10 | 45.98ms | 0.00 | ||
| PX Deq: Table Q Normal | 44 | 0 | 2.63ms | 0.00 | ||
| PX Deq: Parse Reply | 44 | 0 | 1.79ms | 0.00 | ||
| PX Deq Credit: send blkd | 42 | 0 | 182.88us | 0.00 | ||
| PX Deq: Msg Fragment | 8 | 0 | 490.13us | 0.00 | ||
| PX Deq: Table Q Sample | 4 | 0 | 315.50us | 0.00 |
1. buffer busy waits
说明在获取数据的过程中,频繁的产生等待事件,很有可能产生了热点块,也就是说,很多会话都去读取同样的数据块,这一事件等待了5627394次,总共等待了5322924秒,平均等待时间为946毫秒,而且频率也是最高的,有95.9%,等待类别是并发
这里有一个概念:oracle操作的最小单位是块,当一个会话要修改这个块中的一条记录,会读取整个块,如果另一个会话要修改的数据也正好在这个块中,虽然这俩个
2. 会话修改的记录不一样,也会产生等待direct path write temp和direct path read temp 说明用到了临时表空间,那我们再看一下Tablespace IO Stats

各项指标都是非常高的,再根据上面的In-memory Sort是100%,没有产生磁盘排序,也就在排序的时候没有用到临时表空间,进一步推测,多个session,每个session执行的sql语句中多表关联,产生了很多中间数据,pga内存中放不下,
用到了临时表空间,也有可能是用到了lob字段,在用lob字段的时候,也会用到临时表
* 继续看SQL Statistics
根据buffer busy waits等待次数,时间,频率都是最高的,我们重点看逻辑读,物理读,和执行时间最长的sql,把排在前几位的拿出来优化
优化的原则为降低物理读,逻辑读,sql语句中的子操作执行次数尽量少,在看oracle估计出来的执行计划是看不出子操作的执行次数的,要看运行时的执行计划
* 有兴趣的话还可以看一下Segment Statistics
列出了用到的索引和表的使用情况,从这里也能看出索引和表的使用频率
* 也可以看一下Load Profile
里面列出了每秒,每个事务所产生的日志,逻辑读和物理读等指标
02 .AWR报告的分析
001 策略
因为AWR报告非常长,不可能从头到尾一字不漏的去看,要有选择的去看重点部分。最好能对照的来读,即和系统正常情况下的AWR报告对比,找差异。
AWR报告采用总分的形式,前面是系统的整体情况,后面是各个部分细节,一开始不要陷入细节,先分析系统的整体状况,对于后面的专题分析,要根据关注点的不同,采取跳跃式分析。
还要根据具体业务的不同,决定某种现象是否正常。
002 系统整体状况方面
1)Load Profile:分析系
了解系统整体负载状况,如每秒中的事务数/语句数,每秒/每事务物理读写次数(Physical Reads/Writes), 逻辑读写次数(Logical Reads/Writes),SQL语句的解析(Parse),特别是硬解析次数等。
2)Instance Efficiency Percentages:
各指标都应接近100%,除了:execute to parse (70%以上)和parse cpu to parse elapsed。如果不符合,基本可以确定系统存在性能问题;但是如果反过来,即都符合,也不能说明系统完全正常,还要看实际情况。
具体状况方面
1)Top 5 Timed Events:这里列出消耗时间最多的5个等待事件,每种等待说明,都表示一种原因,如:db file
sequential read表示按索引访问出现等待,db file scattered reade表示全表扫描访问出现等待事件。
2)Top N SQL:根据时间消耗,内存消耗,物理I/O等排序,对相关SQL分析执行计划
3)如果是RAC环境,需要特别关注RAC Statistic中的相关指标
4)SGA PGA分析
5)分析表空间、数据文件I/O
003 WORKLOAD REPOSITORY report for

在79分钟里(其间收集了3次快照数据),数据库耗时11分钟,RDA数据中显示系统有8个逻辑CPU(4个物理CPU),平均每个CPU耗时1.4分钟,CPU利用率只有大约2%(1.4/79)。说明系统压力非常小。
可是对于批量系统,数据库的工作负载总是集中在一段时间内。如果快照周期不在这一段时间内,或者快照周期跨度太长而包含了大量的数据库空闲时间,所得出的分析结果是没有意义的。这也说明选择分析时间段很关键,要选择能够代表性能问题的时间段。
004 Report Summary

显示SGA中每个区域的大小(在AMM改变它们之后),可用来与初始参数值比较。
shared pool主要包括library cache和dictionary cache。library cache用来存储最近解析(或编译)后SQL、PL/SQL和Java classes等。library cache用来存储最近引用的数据字典。发生在library cache或dictionary cache的cache miss代价要比发生在buffer cache的代价高得多。因此shared pool的设置要确保最近使用的数据都能被cache。
005 Load Profile
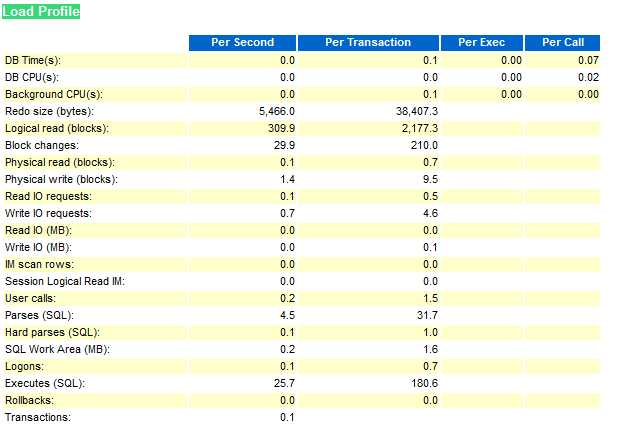
显示数据库负载概况,将之与基线数据比较才具有更多的意义,如果每秒或每事务的负载变化不大,说明应用运行比较稳定。单个的报告数据只说明应用的负载情况,绝大多数据并没有一个所谓“正确”的值,然而Logons大于每秒1~2个、Hard parses大于每秒100、全部parses超过每秒300表明可能有争用问题。
Redo size:每秒/每事务产生的redo大小(单位字节),可标志数据库任务的繁重程序。
Logical reads:每秒/每事务逻辑读的块数
Block changes:每秒/每事务修改的块数
Physical reads:每秒/每事务物理读的块数
Physical writes:每秒/每事务物理写的块数
User calls:每秒/每事务用户call次数
Parses:SQL解析的次数
Hard parses:其中硬解析的次数,硬解析太多,说明SQL重用率不高。
Sorts:每秒/每事务的排序次数
Logons:每秒/每事务登录的次数
Executes:每秒/每事务SQL执行次数
Transactions:每秒事务数
Blocks changed per Read:表示逻辑读用于修改数据块的比例
Recursive Call:递归调用占所有操作的比率
Rollback per transaction:每事务的回滚率
Rows per Sort:每次排序的行数
注:
Oracle的硬解析和软解析
提到软解析(soft prase)和硬解析(hard prase),就不能不说一下Oracle对sql的处理过程。当你发出一条sql语句交付Oracle,在执行和获取结果前,Oracle对此sql将进行几个步骤的处理过程:
1、语法检查(syntax check)
检查此sql的拼写是否语法。
2、语义检查(semantic check)
诸如检查sql语句中的访问对象是否存在及该用户是否具备相应的权限。
3、对sql语句进行解析(prase)
利用内部算法对sql进行解析,生成解析树(parse tree)及执行计划(execution plan)。
4、执行sql,返回结果(execute and return)
其中,软、硬解析就发生在第三个过程里。
Oracle利用内部的hash算法来取得该sql的hash值,然后在library cache里查找是否存在该hash值;
假设存在,则将此sql与cache中的进行比较;
假设“相同”,就将利用已有的解析树与执行计划,而省略了优化器的相关工作。这也就是软解析的过程。
诚然,如果上面的2个假设中任有一个不成立,那么优化器都将进行创建解析树、生成执行计划的动作。这个过程就叫硬解析。
创建解析树、生成执行计划对于sql的执行来说是开销昂贵的动作,所以,应当极力避免硬解析,尽量使用软解析。
006 Instance Efficiency Percentages (Target 100%)
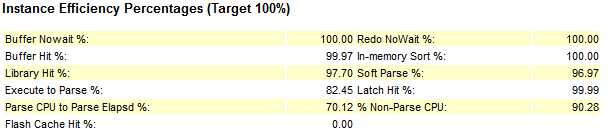
本节包含了Oracle关键指标的内存命中率及其它数据库实例操作的效率。其中Buffer Hit Ratio 也称Cache Hit Ratio,Library Hit ratio也称Library Cache Hit ratio。同Load Profile一节相同,这一节也没有所谓“正确”的值,而只能根据应用的特点判断是否合适。在一个使用直接读执行大型并行查询的DSS环境,20%的Buffer Hit Ratio是可以接受的,而这个值对于一个OLTP系统是完全不能接受的。根据Oracle的经验,对于OLTPT系统,Buffer Hit Ratio理想应该在90%以上。
Buffer Nowait表示在内存获得数据的未等待比例。
buffer hit表示进程从内存中找到数据块的比率,监视这个值是否发生重大变化比这个值本身更重要。对于一般的OLTP系统,如果此值低于80%,应该给数据库分配更多的内存。
Redo NoWait表示在LOG缓冲区获得BUFFER的未等待比例。如果太低(可参考90%阀值),考虑增加LOG BUFFER。
library hit表示Oracle从Library Cache中检索到一个解析过的SQL或PL/SQL语句的比率,当应用程序调用SQL或存储过程时,Oracle检查Library Cache确定是否存在解析过的版本,如果存在,Oracle立即执行语句;如果不存在,Oracle解析此语句,并在Library Cache中为它分配共享SQL区。低的library hit ratio会导致过多的解析,增加CPU消耗,降低性能。如果library hit ratio低于90%,可能需要调大shared pool区。
Latch Hit:Latch是一种保护内存结构的锁,可以认为是SERVER进程获取访问内存数据结构的许可。要确保Latch Hit>99%,否则意味着Shared Pool latch争用,可能由于未共享的SQL,或者Library Cache太小,可使用绑定变更或调大Shared Pool解决。
Parse CPU to Parse Elapsd:解析实际运行时间/(解析实际运行时间+解析中等待资源时间),越高越好。
Non-Parse CPU :SQL实际运行时间/(SQL实际运行时间+SQL解析时间),太低表示解析消耗时间过多。
Execute to Parse:是语句执行与分析的比例,如果要SQL重用率高,则这个比例会很高。该值越高表示一次解析后被重复执行的次数越多。
In-memory Sort:在内存中排序的比率,如果过低说明有大量的排序在临时表空间中进行。考虑调大PGA。
Soft Parse:软解析的百分比(softs/softs+hards),近似当作sql在共享区的命中率,太低则需要调整应用使用绑定变量。
007 hared Pool Statistics

Memory Usage %:对于一个已经运行一段时间的数据库来说,共享池内存使用率,应该稳定在75%-90%间,如果太小,说明Shared Pool有浪费,而如果高于90,说明共享池中有争用,内存不足。
SQL with executions>1:执行次数大于1的sql比率,如果此值太小,说明需要在应用中更多使用绑定变量,避免过多SQL解析。
Memory for SQL w/exec>1:执行次数大于1的SQL消耗内存的占比。
参考文章: https://blog.csdn.net/haojiubujian920416/article/details/81511030

原文:https://www.cnblogs.com/kingle-study/p/10723682.html
【说明】:本文章由站长整理发布,文章内容不代表本站观点,如文中有侵权行为,请与本站客服联系(QQ:254677821)!